.png?width=400&height=69&name=Namibia_Weather%20(4).png "Namibia Weather")
El Nino Southern Oscillation Quick-Look Images
(Current Observations and Forecasts)
PDF : El Nino/Southern Oscillation (ENSO) Diagnostic Discussion
PDF : Weekly ENSO Update (Updated Mondays)
--- Current Conditions ---
Equatorial Pacific Ocean Sea Surface Wind and Water Temperature Anomaly
Courtesy: NOAA PMEL
Lower panel: West-to-east winds and warmer than normal water temps are indicative of El Nino

20 Degree Thermocline Depth and Position Time Series
Courtesy: NOAA PMEL
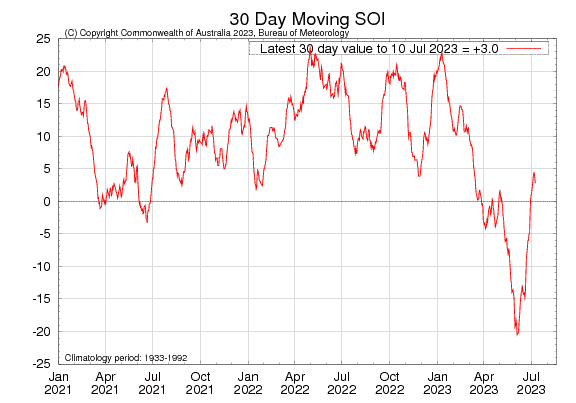
Southern Oscillation Index
Courtesy: BOM
Measures the relative surface pressure difference between Darwin Australia and Tahiti. Consistently negative values indicate El Nino, positive values La Nina. Short negative spikes are associated with the active phase of the MJO. Continual active MJO events contribute greatly to the SOI and each individual event can generate westerly wind bursts that result in Kelvin Waves.
Tropical Sea Surface Temperature Animation
Courtesy: CPC
Weekly averaged sea surface temperatures (top,°C) and anomalies (bottom,°C) for the past twelve weeks. SST analysis is the optimum interpolation (OI) analysis, while anomalies are departures from the adjusted OI climatology (Reynolds and Smith 1995, J. Climate, 8, 1571-1583).
Nino Regions Anomalies
Courtesy: CPC

Equatorial Pacific Sea Surface Temperature Forecast
Nino 3.4
Courtesy: NCEP NOAA CPC
Notice that the average of many separate runs of many models generally suggesting warmer than normal waters well off Ecuador and slowly settling back to a normal pattern by March 2013 consistent with a weak El Nino at best.